Today, nearly 1 in 5 small business owners in America is foreign-born. Entrepreneurs in immigrant populations are starting new businesses in record numbers and spuring growth in the American economy.
In this article, accompanied with an infographic, we take a look at where they are finding success.
Immigrants Play an Important and Growing Role
More Foreign-Born Workers Enter Labor Force and Ownership
Immigrants are joining the U.S. labor force and starting new businesses in steadily rising numbers.
This graphic compares immigrant labor force and small business owners in 1990 and 2010.

Immigrant-Owned Businesses Drive Small Business Growth
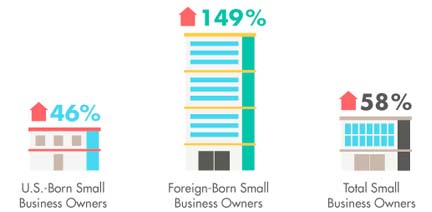
Of the 1.8 million new small business owners between 1990 and 2010, 30 percent were foreign-born.
This graphic shows the change in number of small business owners 1990 – 2010

Immigrant-Owned Business at a Glance
A study by the Small Business Administration revealed a few distinct characteristics of immigrant-owned businesses.
Immigrant-owned businesses are:
- More likely to hire employees
- More likely to export their goods and services
- Typically started with higher levels of startup capital than non-immigrant-owner businesses
Where Foreign-Born Business Owners Originate
Mexico and India are the Top Birth Countries for Business Owners
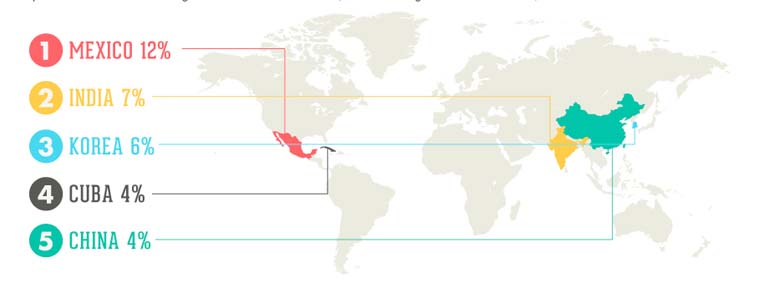
Roughly 1 in 10 immigrant small business owners in the U.S. are Mexican-born.
This graphic shows the top countries of birth for immigrant small business owners (share of immigrant business owners)

Greece Tops Other Countries for Population’s Rate of Business Ownership
16 percent of the Greek-born labor force is made up of business owners.
This graphic shows which countries of birth with greatest rate of business ownership (business owners as a share of labor force)

Where Foreign-Born Business Owners Thrive
Foreign-Born Business Owners Dominate Service-Based Industries
There are more restaurant owners among immigrant small business owners than any other business type.

How States Fare for Immigrants Business Owners
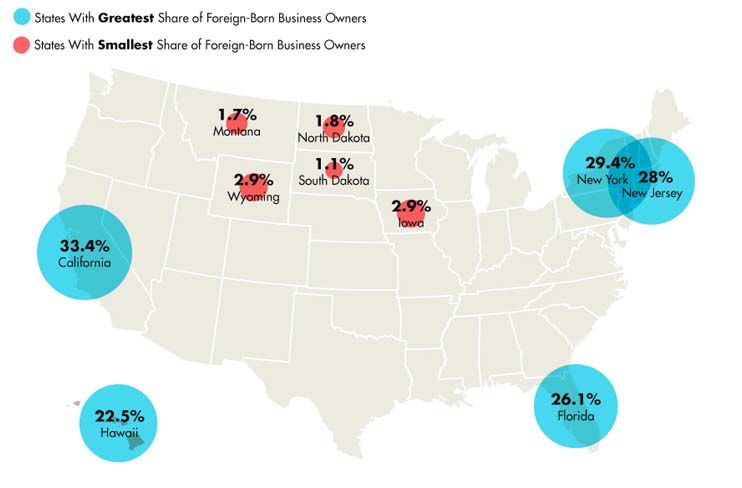
A third of all business owners in California are foreign-born, compared to barely 1 percent in South Dakota.

Here is the entire infographic courtesy of Intuit.


